A little wonder, every day
CO2 in Cities
1 / 5
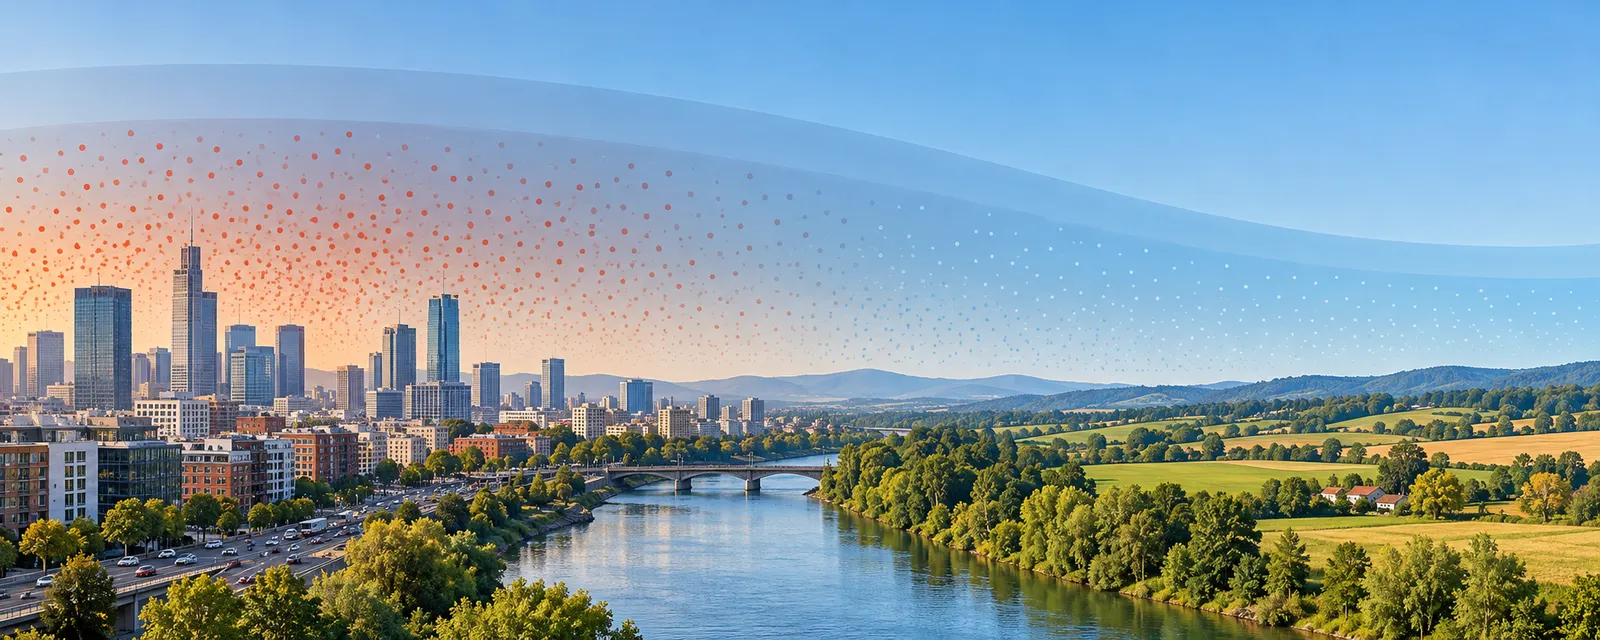
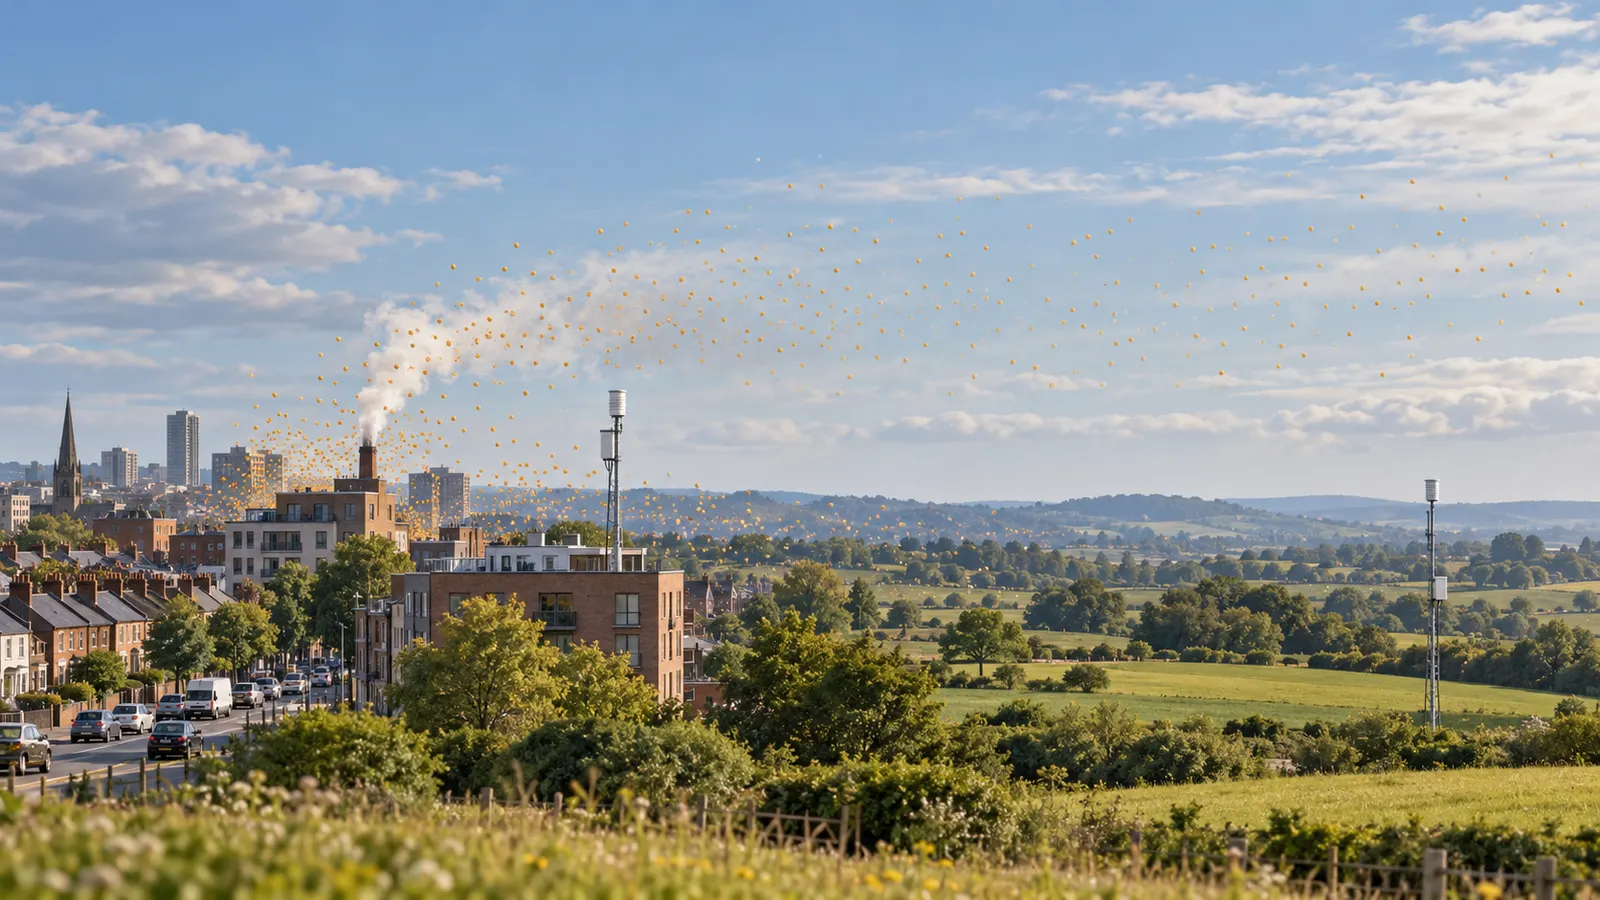
додаткова AI-синтетична концептуальна ілюстрація міського й сільського ландшафту; не вимірювальна карта й не зображення конкретного міста. Автор: OpenAI image generation. Умови сервісу слід перевірити перед комерційним використанням. Відео/GIF не додано.
Listen to fact0:00 / —
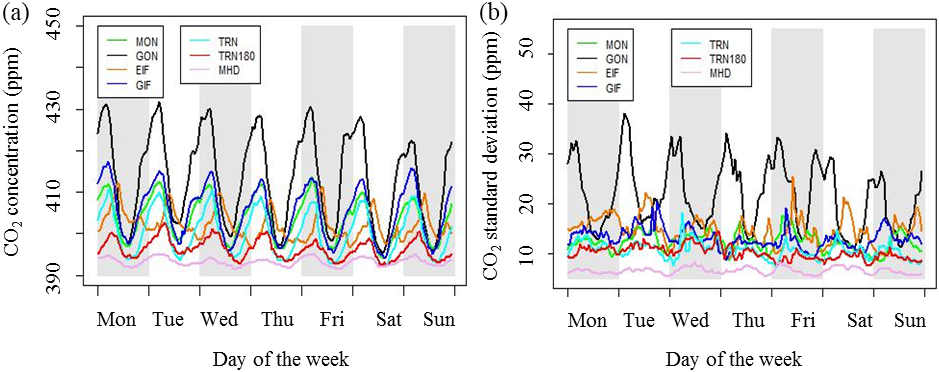
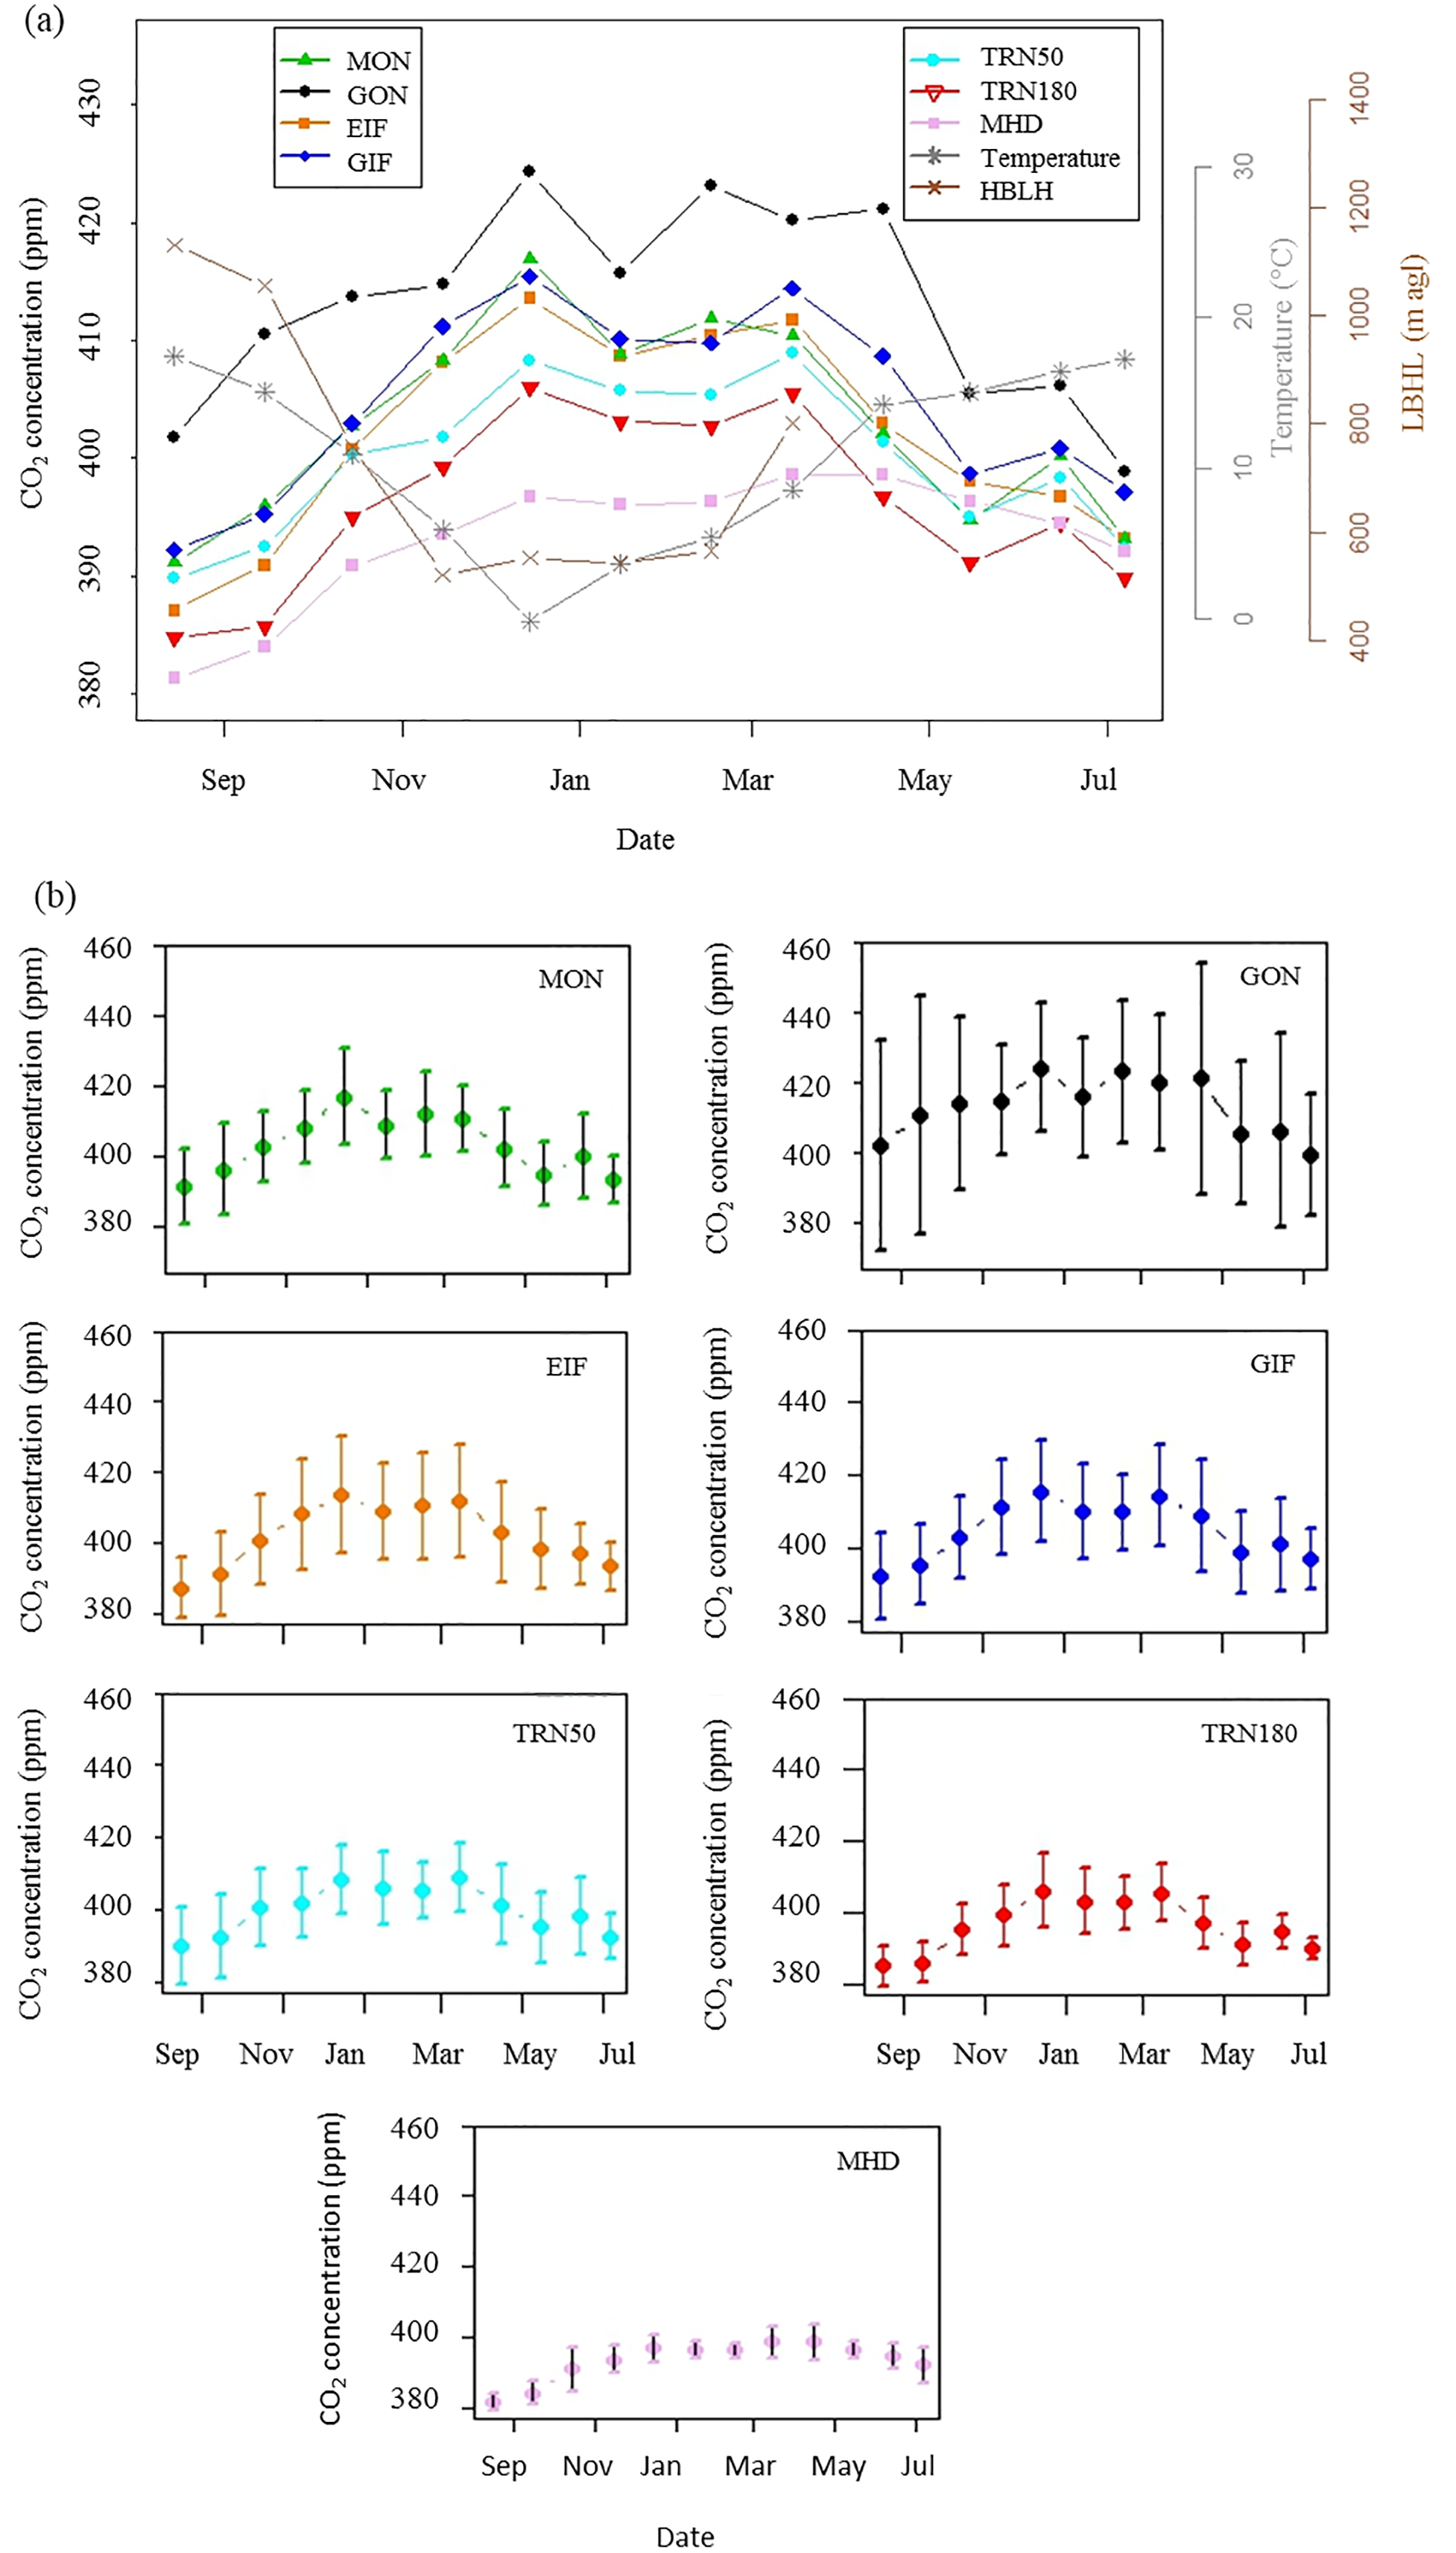
Urban CO₂ gradients reflect fossil-fuel emissions, respiration and photosynthesis by vegetation, boundary-layer height, and advection. In Paris, near-surface concentrations varied by time of day, season, and synoptic conditions; evening or stronger mixing can weaken the contrast, and local comparisons can reverse. A short concentration measurement therefore is not equivalent to a city’s emissions or a permanent air composition. [1–3]